-
+1 - 312-224-1615
Get in touch with us
-
support@helpwithassignment.com
Send us an e-mail
Karl Pearson's Coefficient Assignment Help
The best karl pearson's coefficient assignment help service, provided by subject matter experts.
Prices starting $9.5/page

Rated #1
provider for the last 10 successive years

1,50,503
assignments delivered.
340, just
today
Get Karl Pearson’s Product-moment Correlation Coefficient Assignment Help Now!
HelpWithAssignment provides the best and the most accurate Karl Pearson’s Product-moment Correlation Coefficient assignments. Our statistics assignment tutors are well versed with the concepts of Karl Pearson’s Product-moment Correlation Coefficient and can help you provide precise answers and analysis pertaining to the subject. Our assignments experts are all equipped with master degrees and PhDs in statistics and can help you get good grades in your Karl Pearson’s Product-moment Correlation Coefficient assignments.
Our team of online statistics homework tutors will help you solve difficult Karl Pearson’s Product-moment Correlation Coefficient homework problems, thoroughly examine the procedure used as well as the solution arrived at and make sure that you understand the key concepts highlighted in your homework assignment.

Are you struggling with Karl Pearson’s Product-Moment Correlation Coefficient Problems? Do you need Karl Pearson’s Product-Moment Correlation Coefficient Help? Karl Pearson’s Product-Moment Correlation Coefficient Homework Help?
Karl Pearson’s Product-Moment Correlation Coefficient or simply Pearson’s Correlation Coefficient for short, is one of the important methods used in Statistics to measure Correlation between two variables.
A few words about Karl Pearson. Karl Pearson was a British mathematician, statistician, lawyer and a eugenicist. He established the discipline of mathematical statistics. He founded the world’s first statistics department In the University of London in the year 1911. He along with his colleagues Weldon and Galton founded the journal “Biometrika” whose object was the development of statistical theory.
The Correlation between two variables X and Y, which are measured using Pearson’s Coefficient, give the values between +1 and -1. When measured in population the Pearson’s Coefficient is designated the value of Greek letter rho (ρ). But, when studying a sample, it is designated the letter r. It is therefore sometimes called Pearson’s r. Pearson’s coefficient reflects the linear relationship between two variables. As mentioned above if the correlation coefficient is +1 then there is a perfect positive linear relationship between variables, and if it is -1 then there is a perfect negative linear relationship between the variables. And 0 denotes that there is no relationship between the two variables.
The degrees -1, +1 and 0 are theoretical results and are not generally found in normal circumstances. That means the results cannot be more than -1, +1. These are the upper and the lower limits.
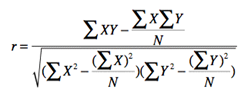
Pearson’s Coefficient computational formula
Sample question: compute the value of the correlation coefficient from the following table:
|
Subject
|
Age x
|
Weight Level y
|
|
1
|
43
|
99
|
|
2
|
21
|
65
|
|
3
|
25
|
79
|
|
4
|
42
|
75
|
|
5
|
57
|
87
|
|
6
|
59
|
81
|
Step 1: Make a chart. Use the given data, and add three more columns: xy, x2, and y2.
|
Subject
|
Age x
|
Weight Level y
|
xy
|
x2
|
y2
|
|
1
|
43
|
99
|
|||
|
2
|
21
|
65
|
|||
|
3
|
25
|
79
|
|||
|
4
|
42
|
75
|
|||
|
5
|
57
|
87
|
|||
|
6
|
59
|
81
|
Step 2: Multiply x and y together to fill the xy column. For example, row 1 would be 43 × 99 = 4,257
Step 3: Take the square of the numbers in the x column, and put the result in the x2 column
|
Subject
|
Age x
|
Weight Level y
|
xy
|
x2
|
y2
|
|
1
|
43
|
99
|
4257
|
1849
|
|
|
2
|
21
|
65
|
1365
|
441
|
|
|
3
|
25
|
79
|
1975
|
625
|
|
|
4
|
42
|
75
|
3150
|
1764
|
|
|
5
|
57
|
87
|
4959
|
3249
|
|
|
6
|
59
|
81
|
4779
|
3481
|
Step 4: Take the square of the numbers in the y column, and put the result in the y2 column.
Step 5: Add up all of the numbers in the columns and put the result at the bottom.2 column. The Greek letter sigma (Σ) is a short way of saying “sum of.”
|
Subject
|
Age x
|
Weight Level y
|
xy
|
x2
|
y2
|
|
1
|
43
|
99
|
4257
|
1849
|
9801
|
|
2
|
21
|
65
|
1365
|
441
|
4225
|
|
3
|
25
|
79
|
1975
|
625
|
6241
|
|
4
|
42
|
75
|
3150
|
1764
|
5625
|
|
5
|
57
|
87
|
4959
|
3249
|
7569
|
|
6
|
59
|
81
|
4779
|
3481
|
6561
|
|
Σ
|
247
|
486
|
20485
|
11409
|
40022
|
Step 6: Use the following formula to work out the correlation coefficient.
The answer is: 1.3787 × 10⁻⁴
The range of the correlation coefficient is from -1 to 1. Since our result is 1.3787 × 10⁻⁴, a tiny positive amount, we can’t draw any conclusions one way or another.
Meet our online statistics homework help experts:
All our online statistics homework help experts are highly qualified professionals with years of experience in conducting Karl Pearson’s Product-moment Correlation Coefficient analysis.
- Equipped with a PhD in correlation analysis of market oriented parameters, our head tutor is also associated with research firms like Nielson UK. Over the past 10 years, he has helped various students with their Karl Pearson’s Product-moment Correlation Coefficient analysis.
- Currently associated with a top university of New York, our tutor is also an expert in correlation coefficients and Karl Pearson’s Product-moment Correlation Coefficient analysis. She has developed deep understanding and research on the relationship between two variables in any given case and has successfully implemented the techniques in many research papers of students along with individual statistics case study assignments for students.
- Now working as a data analyst in Milward Brown, our tutor has joined our team of Karl Pearson’s Product-moment Correlation Coefficient analysis expert, last January and since then has helped many students get fantastic grades in their individual assignments.
What do our Karl Pearson’s Product-moment Correlation Coefficient Assignment Help Customers have to say?
"Correlation analysis was never my cup of tea and when my professor asked us to conduct the analysis using Karl Pearson’s Product-moment Correlation Coefficient analysis, I was really worried. However, thankfully I just came across the team of statistician at HwA and they helped me to get good grades at the end."Lauren Robertson, Sept 2016
"Honestly speaking, the thought of all the Greek Alphabets, wedged between the numbers traumatized me before I came across the statistics and Karl Pearson’s Product-moment Correlation Coefficient tutors of HwA. Now I am doing my masters and consider myself an expert in Karl Pearson’s Product-moment Correlation Coefficient analysis and had done several of them with the help of this excellent team." Sarah Marcotte, Aug 2016
HelpWithAssignment.com provides high quality and accurate solutions at the lowest cost in the industry. We provide you with the following guarantees:
- Accurate Answers: Karl Pearson’s Product-moment Correlation Coefficient analysis deals with the correct result and evaluation and our team of experts can certainly assure you the correct answers to your assignment problems.
- Track your orders: We have a tracking facility that tracks your orders. This tool enables you to know your order status and gives the estimated time of delivery. Put your mind at ease by seeing the progress of your Karl Pearson’s Product-moment Correlation Coefficient homework assignment before it is submitted to see if it is going as you want.
- Lowest Cost: We know that you are students and have limitations as far as spending capacity is concern. Our packages are highly affordable and whether you take help only once or for your entire semester, our rates are on the lower side.
- Unlimited iterations: Is your Karl Pearson’s Product-moment Correlation Coefficient quiz help not as per your requirement? At HelpWithAssignment, you can request for unlimited number of revisions till the assignment or quiz is not exactly as you require it.

HelpWithAssignment provides timely help at affordable charges with detailed answers to your assignments, homework , research paper writing, research critique, case studies or term papers so that you get to understand your assignments better apart from having the answers. The team has helped a number of students pursuing education through regular and online universities, institutes or online Programs.