
Simulate Topological Malware Propagation Using MATLAB
Question
You are required to simulate topological malware propagation in a simplified network by using discrete-time simulation technique. Until nowadays we still do not have a good analytical model to model malware spreading in a topological network. Email virus/worm, social-network based virus/worm, smart phone virus/worm based on Bluetooth communication, etc., all of them can be treated as topological malware.
A strict two-dimensional grid topology.
Considering a computer network follows a strictly defined two-dimensional grid topology like the following:
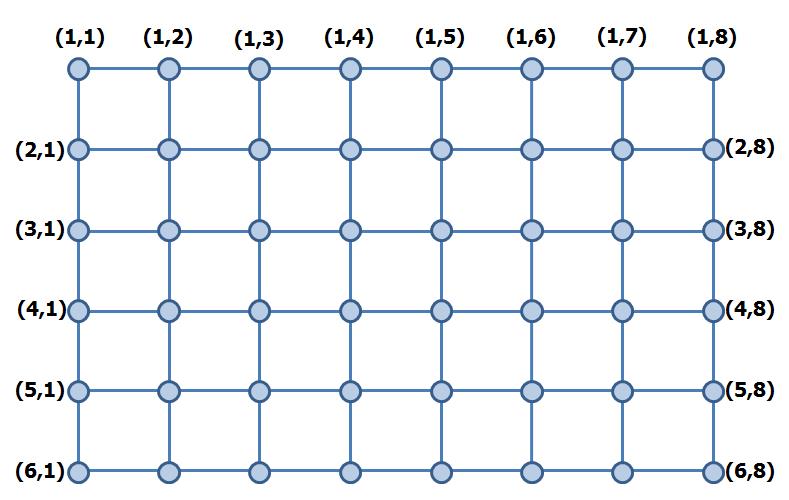
Each node represents a computer that can be compromised by the malware. A malware-infected node can only infect nodes directly connected with it. Each node is uniquely identified by its position in the grid. For example, Node(m,n) represents the node at the m-th row and n-th column in the grid. Suppose the network under study has m rows and n columns (i.e., node population is N = m´n).
Infection process: Once a node is infected at the discrete time t, it will send out infectious traffic once and only once to arrive at all its neighbors at the time tick t+x+1, where x is a random variable following Poisson distribution with parameter l (x could take values of 0,1,2,3,….). Then at the time t+x+1, If the neighbor is already infected, such traffic will be ignored; if the neighbor is still vulnerable, it will be infected with the fixed probability p at the current discrete time t + x+1.
Simulation: Suppose the parameters are: m=300, n=300, l=10, p = 0.6. You need to conduct the simulation for 40 runs, in each simulation run the following 10 nodes are infected initially (i.e., at t=0): Node(1,1), Node(2,2), Node(3,3),….Node(10,10); and stop each simulation run when there will be no infectious traffic being generated any more. Obtain the total number of infected computers at each discrete time t, represented by I(t). In the end, obtain the average value of I(t) at each discrete time t over those 40 runs.
Report:
(1). Draw a figure shows this average value of I(t) averaged over these 40 simulation runs.
(2). Draw a figure shows the value of I(t) for the first 3 simulation runs.
(3). Since we have obtained 40 values of I(t) for any given time t from those 40 simulation runs, what is the mean value and variance of this random variable I(t) when t goes to infinite? What is the mean and variance of I(t) when t=100?
Summary
This question belongs to MATLAB software and discusses about to simulate topological malware propagation in a simplified network by using discrete-time simulation technique.
Answer is in MATLAB format