
Script to Create Three Plots of Reliability as A Function of Time Using MATLAB
Question
In reliability analysis, the Weibull distribution can be used to model the life of many different systems. The reliability function for this distribution (which can be used to predict survival probability) is modeled by:
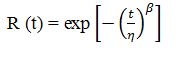
Where R(t) is the reliability as a function of time, β is the shape parameter, η is the scale parameter, and t is time. Because reliability is a probability, it does not have units.
Write a MATLAB script to create three plots of reliability as a function of time, using scale parameter values of 1.2, 1.5, and 2.5. Use a time domain between 0 and 3 years, in intervals of 0.2. For the shape parameter, use 1.2. Create all lines on the same plot, and use a grid. Use a symbol or different line-type for each plot, and include a legend.
Summary
This question belongs to MATLAB software and discusses about application of MATLAB in physics to write a script to create three plots of reliability as a function of time, using given scale parameter values.