
Plot Storage Modulus and Loss Modulus of a Material Using MATLAB
Question
The dynamic storage modulus G’ and loss modulus G’’ are measures of a material mechanical response to harmonic loading. For many biological materials these moduli can be described by Fung’s Model:
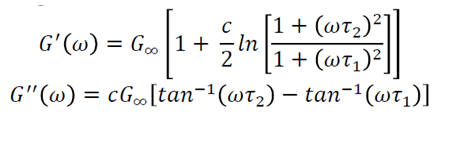
Where ω is the frequency of the harmonic loading and !!,c, !!, and !! are material constants.(tan-1 is atan in matlab).
a) Plot G’ and G’’ versus ω as two separate plots using the following constants:
- = 5 kilo pound per square inch (ksi), c=0.05, = 0.06 seconds, and = 500 seconds.
- Let ω vary from 0.0001 to 1000 second-1. Use a log scale for this axis.
b) Why do you want to use a log scale for the ω axis? Write your answer as a comment in the script. (Hint: What happens if you don’t use a log scale? Try plotting both ways.)
Summary
This question belongs to MATLAB software and discusses about application of MATLAB in physics to plot the storage modulus and loss modulus of a material mechanical response to harmonic loading.