
Interpret either a Digidot Plot  or a Separate Stem-and Leaf and Time Series Plot for given Data
$4.00$2.00619 reads
Question
The following table shows U.S petroleum imports, imports as a percentage of total, and Persian Gulf imports as a percentage of all imports by year since 1973. Construct and interpret either a digidot plot (or a marginal plot) or a separate stem-and leaf and time series plot for each column of data.
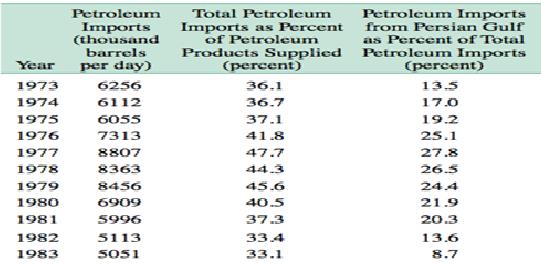
Summary: This question belongs to mathematics and discusses about U.S petroleum imports and to construct and interpret either a digidot plot (or a marginal plot) or a separate stem-and leaf and time series plot for given data.
Total Word count: 10
Related Solutions
Recently Uploaded Solutions
Write an Essay on the Importance of Public RelationsWrite an essay on the positive impact of shareholder power on bonWrite An Essay On What You Want From Work And How To Achieve ItWrite an essay/report on Marketing Mix OrientationWrite an interview structure about poultry litter convert to bio Write Article Reflection On The Article “Improving Teaching And
Most Downloaded Solutions