
Intercept Data In Scatter Plot
Question
As part of the first-year evaluation for new salespeople, Ada, the sales manager for Umbrella, estimates the second-year sales for each salesperson based on his or her sales for the first year. Using data from company records going back several years, she constructs the following scatter plot:
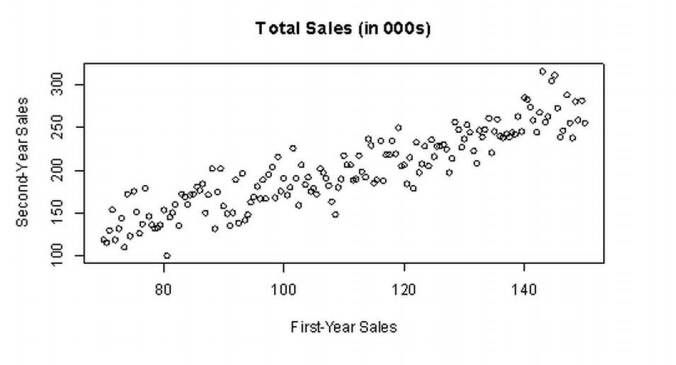
a). Indicate a range of plausible values for the correlation between first- and second-year sales. Note: The acceptable answers are based solely on what you know about the concept of correlation; you need not calculate anything for this part.
b). Ada fits the least-squares line y = 18.22 + 1.66x where x = first-year sales and y is second-year sales. Interpret both the slope and the y-intercept in the context of the problem of estimating second-year sales.
c). What is a potential problem, from your perspective, with using the least-squares line to estimate sales and evaluate employees?
Summary
The question belongs to Statistics and it discusses about the plausible values for correlation between first and second year sales given in the scatter plot.
Total Word Count 138