
Create Two Subplots of the Logarithmic Spiral in the Same Plot Window Using MATLAB
Question
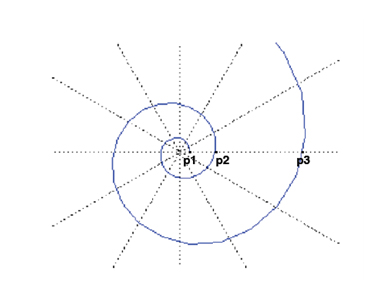
A logarithmic spiral is a shape commonly found in nature, but it also has engineering implications. For instance, the logarithmic spiral of a nautilus shell enables highly efficient fluid transfer without causing turbulent flow. The equations to describe a logarithmic spiral are as follows:
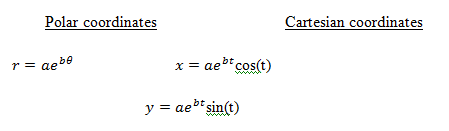
Create two subplots of the logarithmic spiral in the same plot window, one using polar coordinates and one using Cartesian coordinates, with the following values:
a=1/2
b=.3
0 ≤ θ ≤ 10π (use 100 values total)
0 ≤ t ≤ 1000 (use 1000 values total)
Assume radians in all cases. Titles are required, but axis labels are not required. Yes, the second plot will be blocky.
Summary
This question belongs to MATLAB software and discusses about application of MATLAB in physics to create two subplots of the logarithmic spiral in the same plot window.